
Ever had a customer forward a second COA and ask, “Why is this different from yours?†It can feel like someone swapped the product overnight, even when it came from the same lot.
In reality, COA differences are often the predictable outcome of three things: how the sample was taken, which method was used, and how the lab did the math and reporting. Once you know where variation enters the process, it gets much easier to explain, and to prevent repeat disputes.
The three places COA differences usually start
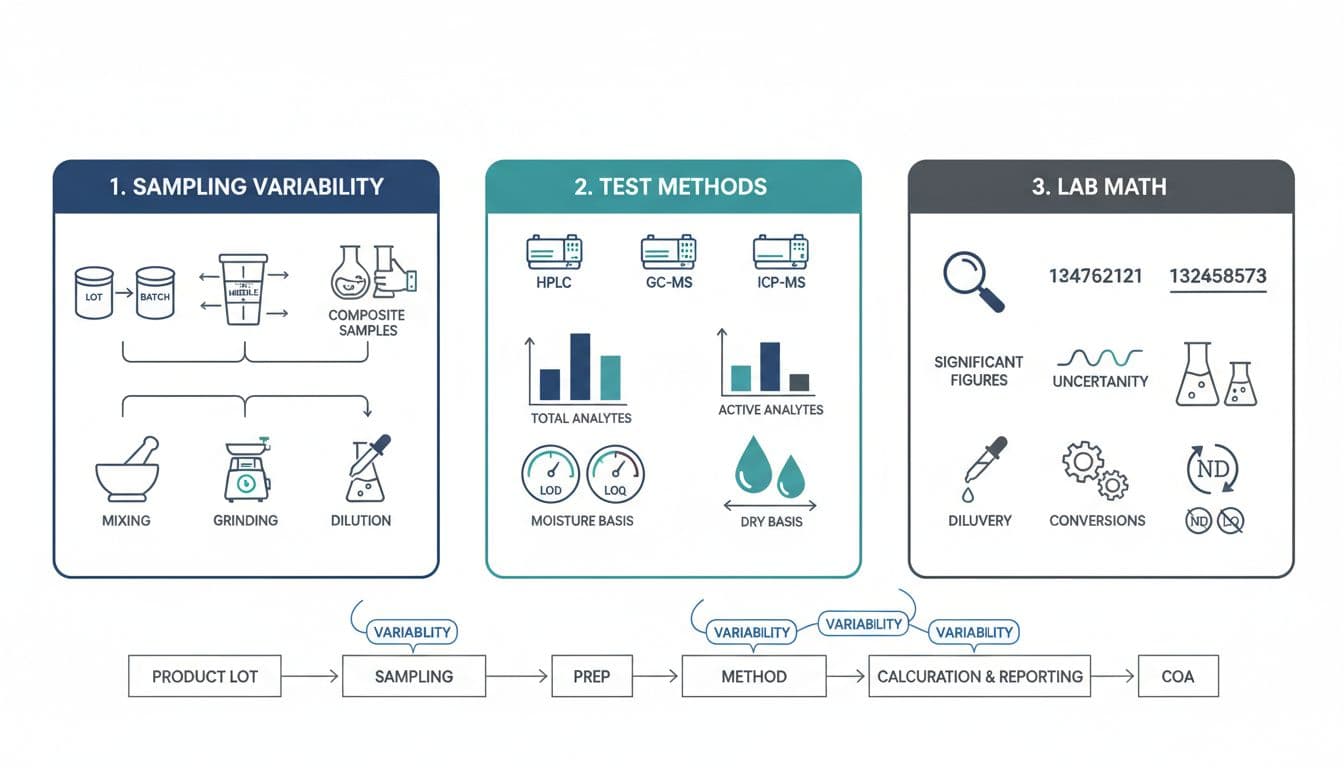
Most “same product, different COA†stories trace back to:
- Sampling variability (what portion of the lot was tested)
- Test method differences (what the method measures, and how)
- Lab math and reporting rules (units, basis, rounding, and flags like ND)
Inter-lab comparisons in cannabis have shown these effects in the real world, which is why programs like the NIST Cannabis Laboratory Quality Assurance Program report matter to QA teams. They highlight that variation is not rare, even with skilled labs.
Sampling variability: the “same lot†is not always the same sample
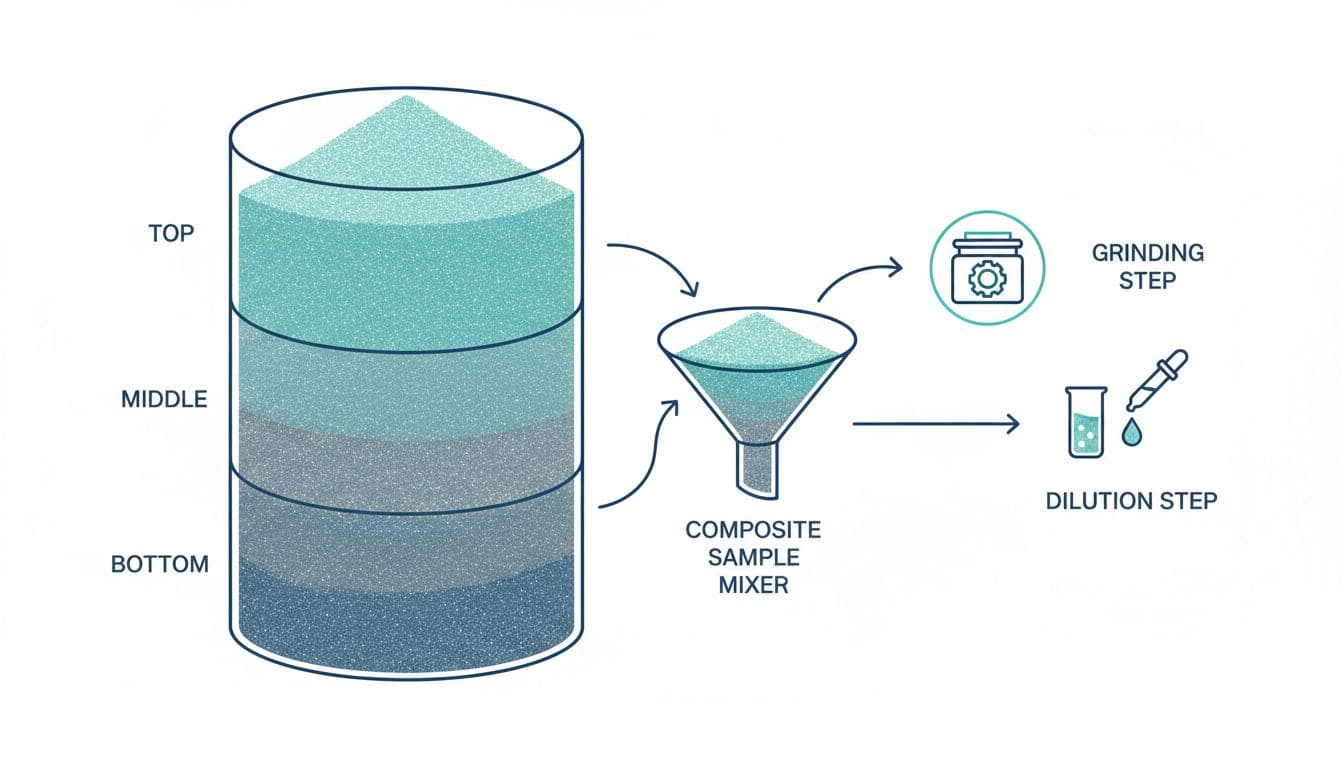
Sampling is the least exciting part of testing, and the most likely place for mismatch.
Think about a jar of soup with herbs that settle. If you taste only the top, you might swear it’s bland. Stir, then taste again, and it’s a different soup. Many cannabis and hemp products behave the same way.
Common sampling reasons two COAs don’t match:
- Grab vs composite samples: One lab gets a single “grab†from one spot. Another gets a composite built from several increments. Composite sampling usually reduces extremes.
- Top, middle, bottom effects: Kief settles in flower, cannabinoids can stratify in powders, and heavy ingredients sink in beverages.
- Homogenization differences: One sampler breaks up nugs and mixes well. Another doesn’t. This alone can swing potency.
- Sample size and grind: Fine grind improves homogeneity, but it can also increase heat and volatility risk for some analytes.
- Timing and handling: Volatiles, moisture, and even light exposure can change results between “initial COA†and “re-test COA.â€
Regulators often spell out sampling expectations because of this. Michigan’s Sampling and Testing Technical Guidance for Marijuana Products is a useful reference when you need to justify why “one jar tested†isn’t always a lot average.
Test method differences: same analyte name, different measurement
Even if two labs sample perfectly, method non-equivalency can still create COA differences.
“Total†vs “active†is a real definition change
A classic example is total THC reporting. Some COAs list Δ9-THC and THCA separately. Others report “Total THC,†often calculated as:
Total THC = Δ9-THC + 0.877 × THCA
Simple example: Δ9-THC = 1.0%, THCA = 20.0%
Total THC = 1.0 + (0.877 × 20.0) = 18.54%
If another lab reports “total†using a different factor, or reports “active THC†after a decarb step, you can end up with two numbers that look conflicting but are based on different definitions. NIST has published method-focused cannabis work (for example, on cannabinoids in smokable hemp) that shows how method details tie directly to reported results: NIST cannabinoids LC method publication page.
Instrument and method choices change what’s measurable
- HPLC vs GC: GC can decarb acidic cannabinoids unless special conditions are used, which shifts THCA toward THC.
- ICP-MS vs ICP-OES (metals): Both are valid, but they differ in sensitivity and interference handling.
- Different extraction solvents and cleanup: Edibles, tinctures, vape oils, and flower all behave differently. Matrix effects are real.
Standards groups like AOAC INTERNATIONAL and ASTM publish methods and guidance to improve comparability, but labs still choose among validated options based on equipment, scope, and matrix.
LOD and LOQ are not just footnotes
A “Not Detected†result can mean “below the detection limit,†not “zero.†Another COA might show “<LOQ†or even a small estimated value near the method limit. Those are different reporting choices, not a secret contaminant appearing.
For a quick refresher on common COA fields and how labs present them, New Jersey’s guide is handy: Cannabis Testing Guidelines and How to Read a Certificate of Analysis.
Lab math and reporting: small choices create big-looking gaps
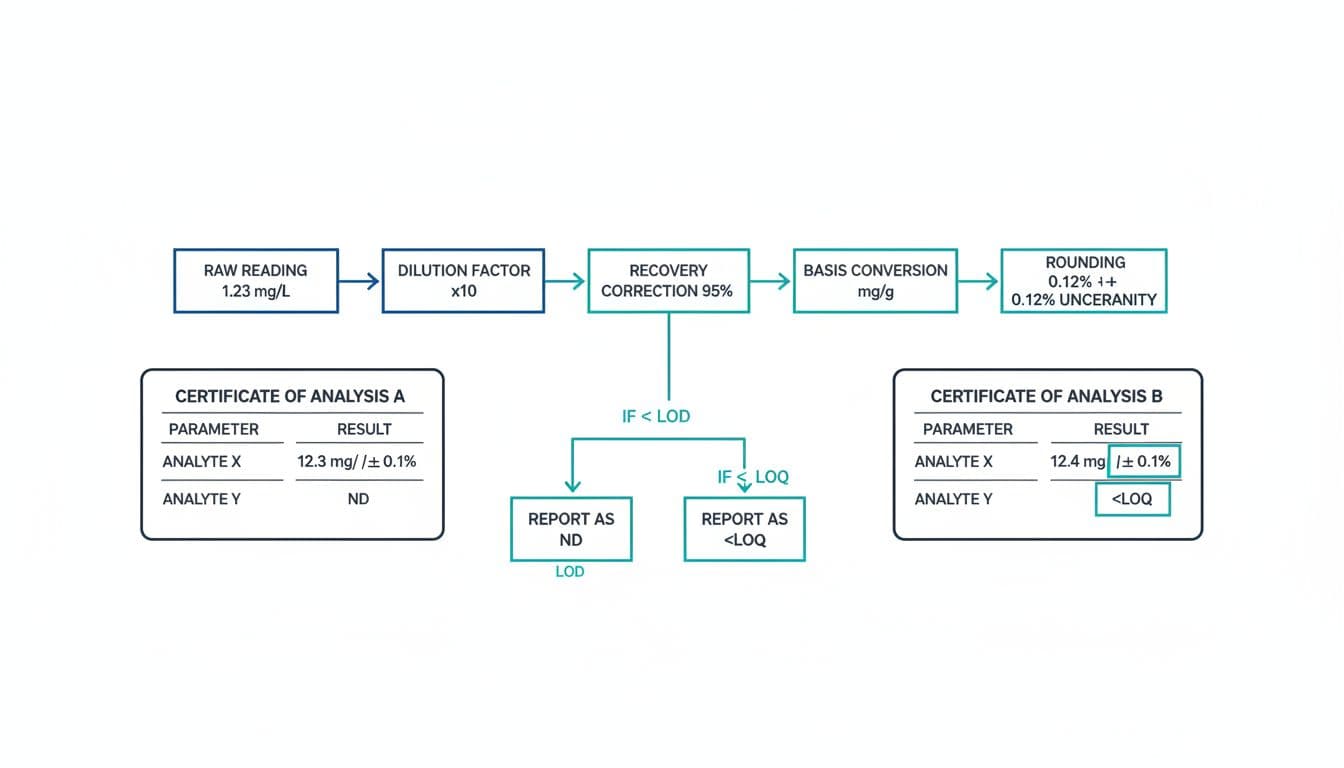
Sometimes both labs measured nearly the same thing, but the reporting makes them look far apart.
Rounding and significant figures
If Lab A reports 0.296% and rounds to 0.30%, while Lab B reports 0.296% as 0.29% due to a different rounding rule, that “difference†is mostly formatting.
Dilution factors and back-calculation
If a sample is diluted 10× to fit a calibration range, the lab multiplies the instrument result by 10.
Example: instrument reads 12 mg/L in extract
Dilution factor: 10×
Reported: 120 mg/L (in extract)
A missed or differently documented dilution step can cause a clean 10× disagreement.
“As-is†vs dry-basis results
Moisture basis is another common culprit.
Example: flower measured at 18.0% total THC “as-is†with 10% moisture.
Dry-basis total THC = 18.0% ÷ (1 − 0.10) = 20.0%
Both numbers can be correct, but they answer different questions.
Unit conversions that confuse customers
| What you have | Equivalent | Quick note |
|---|---|---|
| 10 mg/g | 1% | Because 10 mg per 1,000 mg = 1% |
| 1% | 10 mg/g | Common for potency back-and-forth |
| 100 mg/kg | 100 ppm | Often seen in metals and pesticides |
If two COAs use different units (mg/g vs %), people often misread the magnitude.
Quick disclaimer (worth saying out loud)
Results depend on method and matrix, and every measurement has uncertainty. When stakes are high (regulatory limits, recalls, contract disputes), consult the testing lab about measurement uncertainty, traceability, and whether the two methods are equivalent for your product type. ISO/IEC 17025 labs can also explain their calibration chain and uncertainty approach.
Practical takeaways: what to ask the lab, and what to lock in your specs
Questions to ask the lab when COAs don’t match
- What method ID and instrument were used (and did it include decarb or a “total†calculation)?
- Was the result reported as-is or dry-basis?
- What were the LOD/LOQ, and how does the lab report values near the LOQ (ND, <LOQ, estimated)?
- Was there a dilution factor, and is it shown on the report?
- Can the lab provide measurement uncertainty (even a simple ± range)?
If you need a customer-friendly way to explain what looks suspicious versus what’s normal variation, this checklist-style post can help frame the conversation: COA red flags in cannabinoid lab results.
What to specify in purchase specs and COA requirements
Tight specs prevent most disputes before they start. At minimum, define:
- Method name/ID (and whether “total†uses a specific factor)
- Basis (as-is vs dry-basis, and required moisture reporting)
- Units (%, mg/g, mg/kg) and required significant figures
- LOD/LOQ requirements for each analyte group
- Uncertainty expectation (or at least a statement of how it’s handled)
Handling customer disputes without escalating
- Start with a side-by-side normalization: same basis, same units, same analyte definition.
- Ask for sampling details: where the sample came from, how it was mixed, and whether it was a retain.
- If needed, move to a split sample plan: one homogenized composite split into sealed subsamples, tested by two labs using agreed methods.
- Put the agreement in writing before re-testing, including which COA “wins†if results fall within combined uncertainty.
Conclusion
When two COAs disagree, it’s usually not fraud or magic. It’s sampling, method choice, and reporting math showing up on paper. If you standardize sampling plans, require clear method details, and treat results as measurements with uncertainty, you can explain COA differences with confidence and keep customers focused on what matters: whether the product meets the spec.