

If you’ve ever stared at a COA and wondered why moisture content looks fine, but the cannabis water activity number feels “off,†you’re not alone. It can feel like two tests saying two different things about the same flower.
They’re both talking about water, but they’re answering different QA questions. Moisture content tells you how much water is in the flower. Water activity (aw) tells you how available that water is for mold and microbes, and how that water will behave inside a package over time.
Used together, they’re one of the fastest ways to spot stability risk before it shows up as a failed microbial, a terpene drop, or a crunchy customer experience.
Why both moisture % and aw show up in cannabis QA/QC
Moisture content (percent) has been used in ag products forever. It’s a simple mass balance, and it maps well to drying performance and yield.
Water activity is newer in cannabis, but common in food safety. It’s tied to equilibrium relative humidity (ERH) and helps predict whether microbes can grow on a product during storage. Many cannabis teams use aw because it catches “looks dry, but still risky†situations, especially after packaging or humidity pack use.
If you want a deeper background on why labs report both, this overview from True Labs on water activity vs. moisture content is a helpful primer.
Moisture content vs cannabis water activity: what each measurement really means

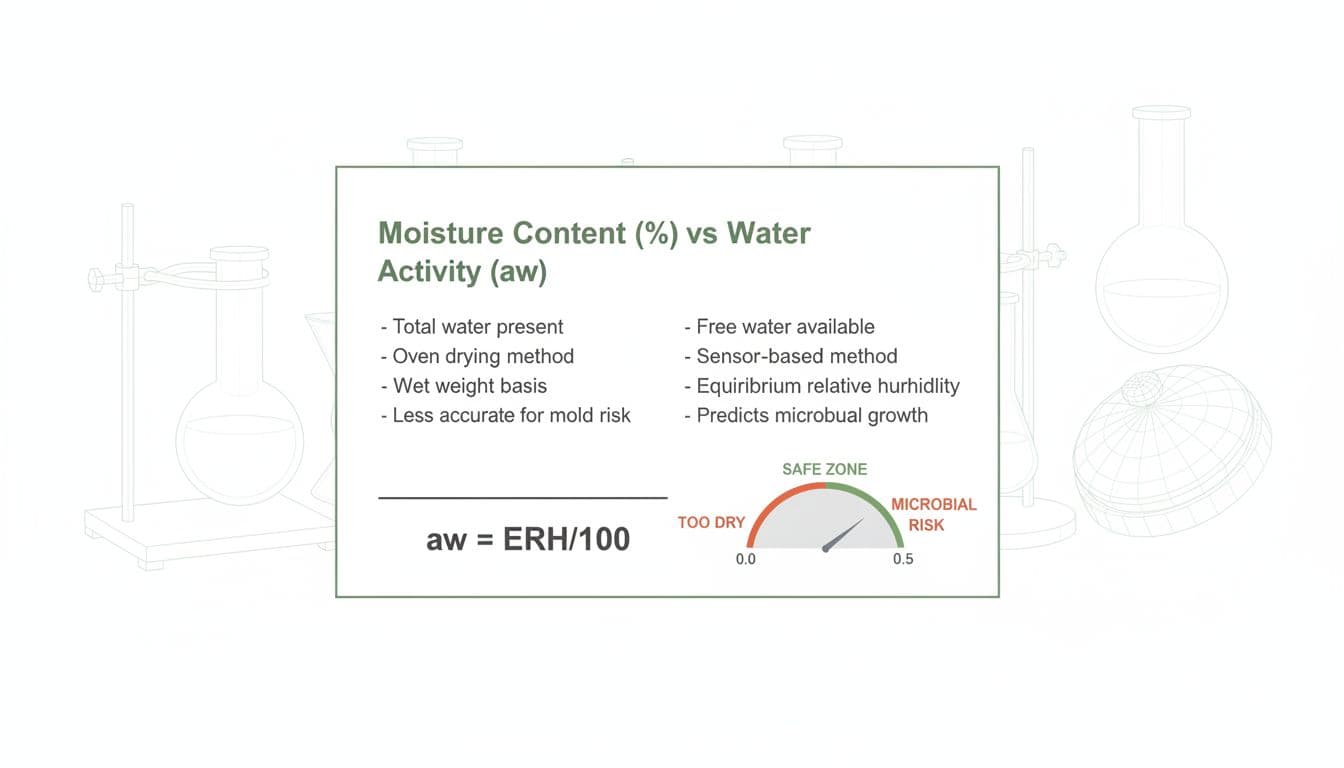
A simple way to picture it: moisture content is how much water is in the sponge, water activity is how easily you can squeeze that water out.
- Moisture content (%) measures total water (bound + free). Two samples can have the same moisture %, but behave differently in storage.
- Water activity (aw) measures the “free†water energy state. It’s closely related to ERH (often expressed as aw = ERH/100). aw is unitless and runs from 0.00 to 1.00.
Here’s a side-by-side view you can use in SOPs and training.
| Category | Moisture content (%) | Water activity (aw) |
|---|---|---|
| What it is | Total water in the sample (bound + free) | Availability of water for microbial growth and chemical change |
| Units | Percent by mass (%) | Unitless (0 to 1) |
| Typical instrumentation | Loss-on-drying moisture analyzer, oven loss, Karl Fischer (less common for flower) | Water activity meter (chilled mirror or sensor-based) |
| What can go wrong | Volatiles lost with heat, uneven grind, stems skew results, incomplete drying in analyzer | Not equilibrated, temperature drift, cup not sealed, sample too small, reading taken before stable |
| What decisions it informs | Drying endpoint, yield math, process control, “too dry†handling | Microbial risk screening, packaging suitability, shelf-life risk, humidity pack strategy |
| Best use in workflow | Track drying and batch uniformity | Verify stability before packaging and after packaging changes |
For more on the “what, how, and why†of aw in cannabis testing, Cannabis Science and Technology has a solid explainer: The What, How, and Why of Water Activity in Cannabis.
Microbial risk primer: why aw is more predictive than moisture %
Microbes don’t care about your moisture %. They care about whether they can access water at the surface and inside micro-spaces of the flower.
That’s why aw is often more predictive than moisture content for microbial growth risk. High moisture with low aw can happen when water is more “bound†in the plant matrix. The reverse can also happen, like when water is redistributed during curing or after adding a humidity control pack, creating localized zones where water is more available.
Most QA teams treat aw as a risk screen because it maps better to storage conditions. It’s also sensitive to temperature, so your measurement conditions matter a lot (more on that below).
Water activity also ties into quality beyond safety. For example, Cannabis Science and Technology has reported on how aw relates to smoking quality and composition in flower (Impact of Water Activity on the Chemical Composition and Smoking Quality of Cannabis Flower).
Using moisture % and aw together: practical decision rules
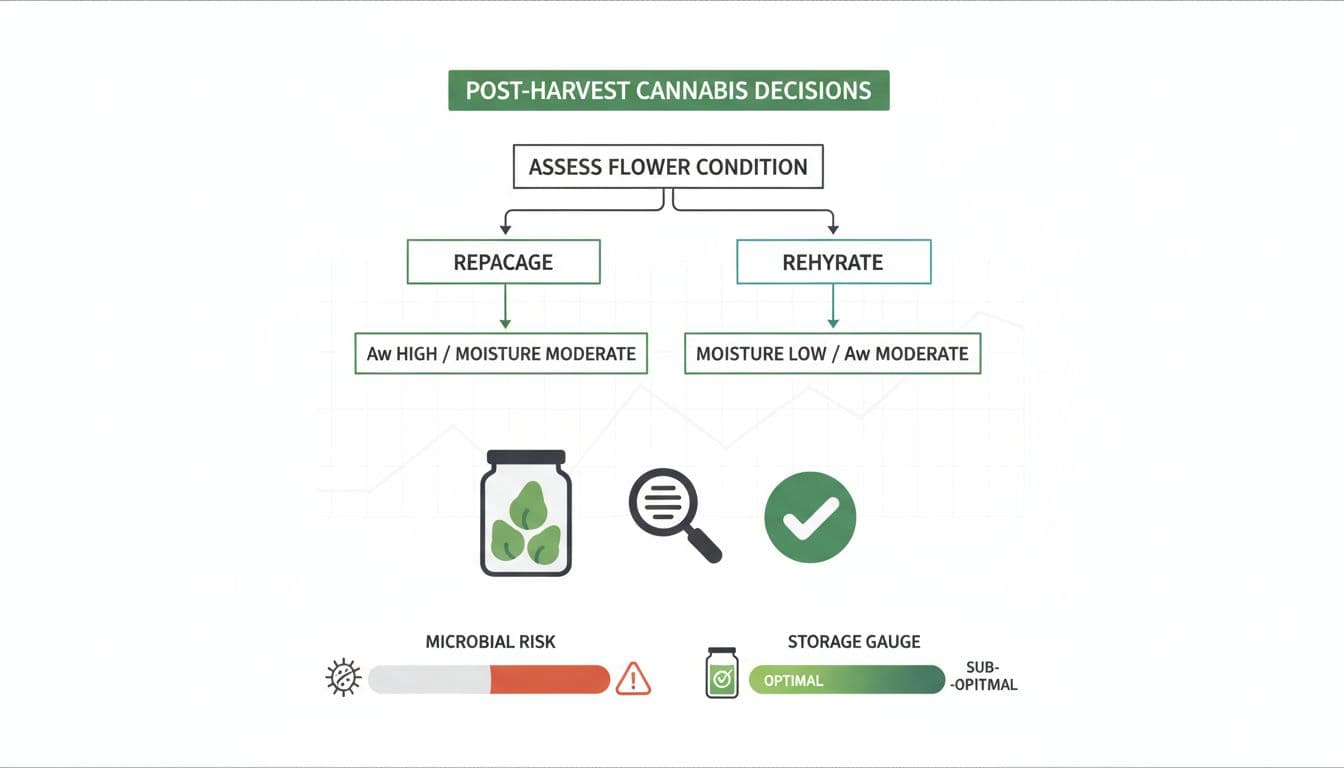
Think of moisture % as your “how much water†control, and aw as your “how risky is that water†control. When they disagree, it usually points to handling, equilibration, or packaging effects.
Practical if/then rules that work well on the floor:
- If aw is high but moisture % is moderate, suspect water redistribution (recent bagging, humidity pack exposure, warm storage, or a wet core). Hold the batch, re-check after a controlled equilibration period, and review packaging and room RH.
- If moisture % is high and aw is high, treat it as an under-dry signal. Keep it out of final packaging, and bring it back to a controlled drying or conditioning step.
- If moisture % is low but aw is moderate, watch for uneven dryness (dry outside, wetter inside) or a measurement artifact (sample prep, temperature). Re-test with consistent prep and confirm stability after the product rests sealed.
- If moisture % is low and aw is low, you’re likely in “quality risk†territory (brittle flower, terpene loss, harsh burn). Your microbial risk may be low, but brand risk goes up.
- If aw swings lot-to-lot while moisture % is stable, look at temperature control, cup sealing, equilibration time, and aw meter verification. That pattern often points to method, not flower.
- If aw rises after packaging, suspect headspace humidity creep, permeability, too much headspace, or a humidity pack pushing ERH higher than expected.
One more operational tip: when you set internal targets, set them as pairs (moisture % and aw), not single numbers. That prevents “passing†one test while missing the real risk.
Sampling, equilibration, temperature, and grind: the details that change results
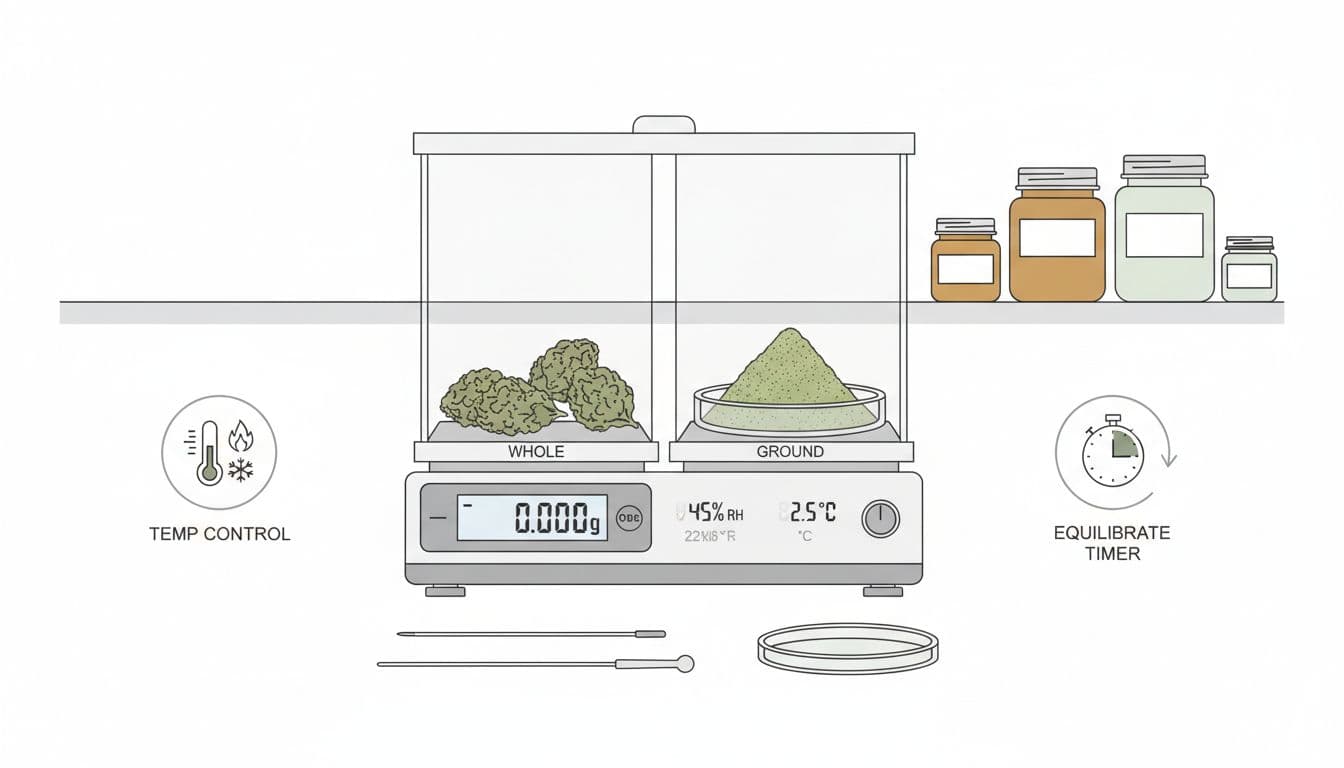
Most “bad†moisture or aw data comes from good instruments and inconsistent sampling.
Sampling basics (keep it boring and repeatable): pull from multiple points in the lot, avoid big stems, and mix gently without grinding the life out of it. If you only sample top buds, you’re measuring the best case.
Equilibration time: aw meters measure vapor equilibrium in a sealed chamber. If you rush the reading, you’re measuring a moving target. Use a consistent sample mass and wait until the reading stabilizes, per your meter’s instructions and your SOP. If you want a method anchor, ASTM has a dedicated practice for flower: ASTM D8196-20 Standard Practice for Determination of Water Activity (aw) in Cannabis Flower.
Temperature effects: aw is temperature-sensitive. Even a few degrees of sample-to-instrument mismatch can shift readings. Store samples sealed, let them come to the same room temp as the meter, and don’t test cups sitting in sun or on warm equipment.
Whole flower vs ground flower: grinding speeds equilibration, but it can also change what you’re measuring by exposing interior moisture and increasing surface area. Pick one approach, validate it, and stick with it. If you must grind, do it gently, avoid heating, and document grinder type and time.
Packaging and headspace equilibration: flower continues to equilibrate after it’s sealed. Headspace size, film permeability, and humidity packs can all move aw. A common best practice is to test aw on flower that has rested sealed long enough to equilibrate, then confirm again after any packaging change (new jar, new liner, new pack).
For a processor-focused view of testing and packaging control using cannabis water activity, Addium’s AROYA guide is a useful reference: Water activity in cannabis testing guide.
Calibration and verification: keep instruments honest
Treat moisture and aw devices like any other critical measurement system.
- aw meters: verify with salt standards or verification checks at multiple points that bracket your working range, log results, and investigate drift fast. Keep cups clean and seals in good shape.
- Moisture analyzers: confirm balance performance with certified weights, review heater temperature checks (as applicable), and periodically cross-check against a reference method your lab trusts.
Just as important, trend your data. A slow shift over weeks is often a method or environment change, not a sudden crop change.
Conclusion (and a quick compliance note)
Moisture % tells you how much water you dried out. Water activity tells you how that remaining water will behave in storage, and how much risk it brings along for the ride. When you track them together, you catch under-dried cores, post-pack humidity creep, and inconsistent sampling before they turn into returns or failed lots.
Targets and pass/fail limits vary by jurisdiction, product type, and lab method, so follow local regulations and your validated SOPs when setting specs and release rules.